Crop Yield
Model variables and parameters
Parameters
| Name | Units | Description |
|---|---|---|
| \(c_{\Gamma}\) | umol{CO2} mol⁻¹{air} K⁻¹ | Determines the effect of canopy temperature on the CO2 compensation point |
| \(C_{Buf}^{max}\) | mg{CH2O} m⁻² | Maximum buffer capacity |
| \(C_{Buf}^{min}\) | mg{CH2O} m⁻² | Minimum amount of carbohydrates in the buffer |
| \(c_{BufFruit_1}^{max}\) | fruits plant⁻¹ s⁻¹ | Regression coefficient |
| \(c_{BufFruit_2}^{max}\) | fruits plant⁻¹ s⁻¹ ºC⁻¹ | Regression coefficient |
| \(c_{Dev_1}\) | s⁻¹ | Regression coefficient |
| \(c_{Dev_2}\) | s⁻¹ ºC⁻¹ | Regression coefficient |
| \(c_{Fruit,g}\) | – | Growth respiration coefficient of fruit |
| \(c_{Fruit,m}\) | s⁻¹ | Maintenance respiration coefficient of fruit |
| \(c_{Leaf,g}\) | – | Growth respiration coefficient of leaf |
| \(c_{Leaf,m}\) | s⁻¹ | Maintenance respiration coefficient of leaf |
| \(c_{RGR}\) | s | Regression coefficient for maintenance respiration |
| \(c_{Stem,g}\) | – | Growth respiration coefficient of stem |
| \(c_{Stem,m}\) | s⁻¹ | Maintenance respiration coefficient of stem |
| \(E_j\) | J mol⁻¹ | Activation energy for \(J^{POT}\) |
| \(G^{max}\) | mg{CH2O} fruit⁻¹ | Potential fruit weight |
| \(H\) | J mol⁻¹ | Deactivation energy |
| \(J_{25Leaf}^{max}\) | umol{e-} m⁻²{leaf} s⁻¹ | Maximum rate of electron transport at 25ºC for the leaf |
| \(LAI^{max}\) | m²{leaf} m⁻² | Maximum leaf area index |
| \(M_{CH2O}\) | mg umol⁻¹ | Molar mass of CH2O |
| \(M_{CO2}\) | mg umol⁻¹ | Molar mass of CO2 |
| \(n_{Dev}\) | – | Number of development stages |
| \(n_{Plants}\) | plants m⁻² | Plants density in the greenhouse |
| \(Q_{10,m}\) | – | \(Q_{10}\) value for temperature effect on maintenance respiration |
| \(r_{BufFruit}^{max,FrtSet}\) | mg{CH2O} m⁻² s⁻¹ | Carbohydrate flow from buffer to the fruits above which fruit set is maximal |
| \(R_g\) | J mol⁻¹ K⁻¹ | Molar gas constant |
| \(rg_{Fruit}\) | mg{CH2O} m⁻² s⁻¹ | Potential fruit growth rate coefficient at 20ºC |
| \(rg_{Leaf}\) | mg{CH2O} m⁻² s⁻¹ | Potential leaf growth rate coefficient at 20ºC |
| \(rg_{Stem}\) | mg{CH2O} m⁻² s⁻¹ | Potential stem growth rate coefficient at 20ºC |
| \(S\) | J mol⁻¹ K⁻¹ | Entropy term |
| \(SLA\) | m²{leaf} mg⁻¹{CH2O} | Specific leaf area index |
| \(T_{25,K}\) | K | Reference temperature at 25ºC |
| \(\alpha\) | umol{e⁻} umol⁻¹{photons} | Conversion factor from photons to electrons |
| \(\eta_{CO2,Air-Stom}\) | – | Conversion factor from the CO2 concentration in the greenhouse air to the stomata |
| \(\eta_{C-DM}\) | mg{DM} mg⁻¹{CH2O} | Conversion factor from carbohydrate to dry matter |
| \(\eta_{Glob-PAR}\) | umol{photons} J⁻¹ | Conversion factor from global radiation to PAR |
| \(\theta\) | – | Degree of curvature of the electron transport rate |
| \(\tau\) | s | Time constant to calculate the 24-h mean temperature |
Variables
| Name | Units | Description |
|---|---|---|
| \(B\) | d⁻¹ | Steepness of the curve |
| \(C_{Buf}\) | mg m⁻² | Carbohydrates in the buffer |
| \(C_{Fruit[j]}\) | mg m⁻² | Amount of fruit carbohydrates in the development stages |
| \(C_{Leaf}\) | mg m⁻² | Carbohydrate weight of the leaves |
| \(C_{Leaf}^{max}\) | mg m⁻² | Maximum allowed carbohydrates stored in the leaves |
| \(C_{Stem}\) | mg m⁻² | Carbohydrate weight of stems and roots |
| \(CO2_{Stom}\) | umol{CO2} mol⁻¹{æir} | CO2 concentration in the stomata |
| \(DM_{Har}\) | mg m⁻² | Accumulated harvested fruit dry matter |
| \(FGP\) | d | Fruit growth period |
| \(GR[j]\) | mg u⁻¹ d⁻¹ | Daily potential growth rate per fruit in a development stage |
| \(g_{T_{Can24}}\) | – | Growth rate dependency to temperature |
| \(h_{C_{Buf}}^{m_{C,AirBuf}}\) | – | Inhibition coefficient of the photosynthesis rate by saturation of the leaves with carbohydrates |
| \(h_{C_{Buf}}^{m_{C,BufOrg}}\) | – | Inhibition coefficient of insufficient carbohydrates in the buffer |
| \(h_{T_{Can}}\) | – | Inhibition coefficient of non-optimal instantaneous canopy temperature |
| \(h_{T_{Can24}}\) | – | Inhibition coefficient of non-optimal 24-h mean canopy temperature |
| \(h_{T_{CanSum}}\) | – | Inhibition coefficient of crop development stage |
| \(h_{T_{CanSum}}^{m_{N,Fruit}}\) | – | Inhibition coefficient of fruit flow |
| \(J\) | umol{e-} m⁻² s⁻¹ | Electron transportation rate |
| \(J_{POT}\) | umol{e-} m⁻² s⁻¹ | Potential rate of electron transport at 25ºC for the canopy |
| \(J_{25Can}^{max}\) | umol{e-} m⁻² s⁻¹ | Maximum rate of electron transport at 25ºC for the canopy |
| \(LAI\) | m²{leaf} m⁻² | Leaf area index |
| \(M\) | d | Fruit development time in days where GR is maximal |
| \(\dot{m}_{C,AirBuf}\) | mg m⁻² s⁻¹ | Net photosynthesis rate |
| \(\dot{m}_{C,AirCan}\) | mg m⁻² s⁻¹ | Carbohydrate flow between the air and the canopy |
| \(\dot{m}_{C,BufAir}\) | mg m⁻² s⁻¹ | Growth respiration of the total plant |
| \(\dot{m}_{C,BufFruit}\) | mg m⁻² s⁻¹ | Carbohydrate flow from the buffer to the fruits |
| \(\dot{m}_{C,BufFruit[1]}\) | mg m⁻² s⁻¹ | Carbohydrate flow to the first development stage |
| \(\dot{m}_{C,BufFruit[j]}\) | mg m⁻² s⁻¹ | Carbohydrate flow from the buffer to the remaining development stages |
| \(\dot{m}_{C,BufLeaf}\) | mg m⁻² s⁻¹ | Carbohydrate flow from the buffer to the leaves |
| \(\dot{m}_{C,BufStem}\) | mg m⁻² s⁻¹ | Carbohydrate flow from the buffer to the stems and roots |
| \(\dot{m}_{C,Fruit[j]Fruit[j+1]}\) | mg m⁻² s⁻¹ | Carbohydrate flow through the fruit development stages |
| \(\dot{m}_{C,FruitAir}\) | mg m⁻² s⁻¹ | Total maintenance respiration of the fruits |
| \(\dot{m}_{C,FruitAir,g}\) | mg m⁻² s⁻¹ | Growth respiration of the fruits |
| \(\dot{m}_{C,FruitAir[j]}\) | mg m⁻² s⁻¹ | Maintenance respiration of the fruits at the development stages |
| \(\dot{m}_{C,FruitHar}\) | mg m⁻² s⁻¹ | Carbohydrate outflow of the last fruit development stage |
| \(\dot{m}_{C,LeafAir}\) | mg m⁻² s⁻¹ | Maintenance respiration of the leaves |
| \(\dot{m}_{C,LeafAir,g}\) | mg m⁻² s⁻¹ | Growth respiration of the leaves |
| \(\dot{m}_{C,LeafHar}\) | mg m⁻² s⁻¹ | Leaf haverst rate |
| \(\dot{m}_{C,StemAir}\) | mg m⁻² s⁻¹ | Maintenance respiration of the stems and roots |
| \(\dot{m}_{C,StemAir,g}\) | mg m⁻² s⁻¹ | Growth respiration of the stems and roots |
| \(\dot{m}_{N,BufFruit[1]}\) | u m⁻² s⁻¹ | Fruit set in the first development stage |
| \(\dot{m}_{N,BufFruit[1]}^{max}\) | u m⁻² s⁻¹ | Maximum fruit set in the first development stage |
| \(\dot{m}_{N,Fruit[j]Fruit[j+1]}\) | u m⁻² s⁻¹ | Fruit flow through the fruit development stages |
| \(N_{Fruit[j]}\) | u m⁻² | Number of fruits in the development stage j |
| \(P\) | umol m⁻² s⁻¹ | Gross photosynthesis rate at canopy level |
| \(PAR_{Can}\) | umol{photon} m⁻² s⁻¹ | Total PAR absorbed by the canopy computed in the solar model |
| \(R\) | umol m⁻² s⁻¹ | Photorespiration during the photosynthesis process |
| \(r_{dev}\) | s⁻¹ | Fruit development rate |
| \(RGR_{Fruit[j]}\) | s⁻¹ | Net relative growth rate of fruits |
| \(RGR_{Leaf}\) | s⁻¹ | Net relative growth rate of leaves |
| \(RGR_{Stem}\) | s⁻¹ | Net relative growth rate of stems and roots |
| \(T_{Can}\) (\(T_{Can,K}\)) | ºC (K) | Canopy temperature |
| \(T_{Can}^{24}\) (\(T_{Can,K}^{24}\)) | ºC (K) | Mean 24-h canopy temperature |
| \(T_{Can}^{Sum}\) (\(T_{Can,K}^{Sum}\)) | ºC (K) | Temperature sum |
| \(t_{j,FGP}\) | d | Number of days after fruit set for development stage j |
| \(W_{Fruit_1}^{Pot}\) | mg u⁻¹ | Potential dry matter per fruit in first fruit development stage |
| \(\Gamma\) | umol{CO2} mol⁻¹{air} | CO2 compensation point |
| \(\eta\) _BufFruit | d m² mg⁻¹ | Conversion factor to ensure that \(\dot{m}_{C,BufFruit}\) equals the sum of the carbohydrates that flow to the different fruit development stages |
Model description
A dynamic tomato crop yield model was implemented to account for the effects of the indoor climate on crop growth and thereby on the harvested dry matter. Although crop growth is related to photosynthesis, most of the existent crop models directly relate these two with the absence of a carbohydrate buffer. The function of the buffer is to store the carbohydrates from the photosynthesis (inflow) and to distribute them to the plant organs (outflow). It has a maximum capacity, above which carbohydrates cannot be stored anymore, and a lower limit, below which the carbohydrate outflow stops. Thus, the in- and out-flows depend on the level of carbohydrates in the buffer and thereby, may not be simultaneous. An approach based on not considering the buffer neglects the non-simultaneous character of the flows. For example, it can neglect the crop growth after dusk, when photosynthesis stops but there may still be carbohydrate distribution if the buffer level is higher than its lower limit. The presence of a carbohydrate buffer is thus important when modeling crop growth.
Models with a common carbohydrate buffer are available in the current literature (e.g. [9], [18], [23], [25], [29]). In this work, a recent yield model [33] developed and validated for a variety of temperatures has been implemented. The model computes the carbohydrates distribution flows in the presence of a buffer, as shown in the figure below.
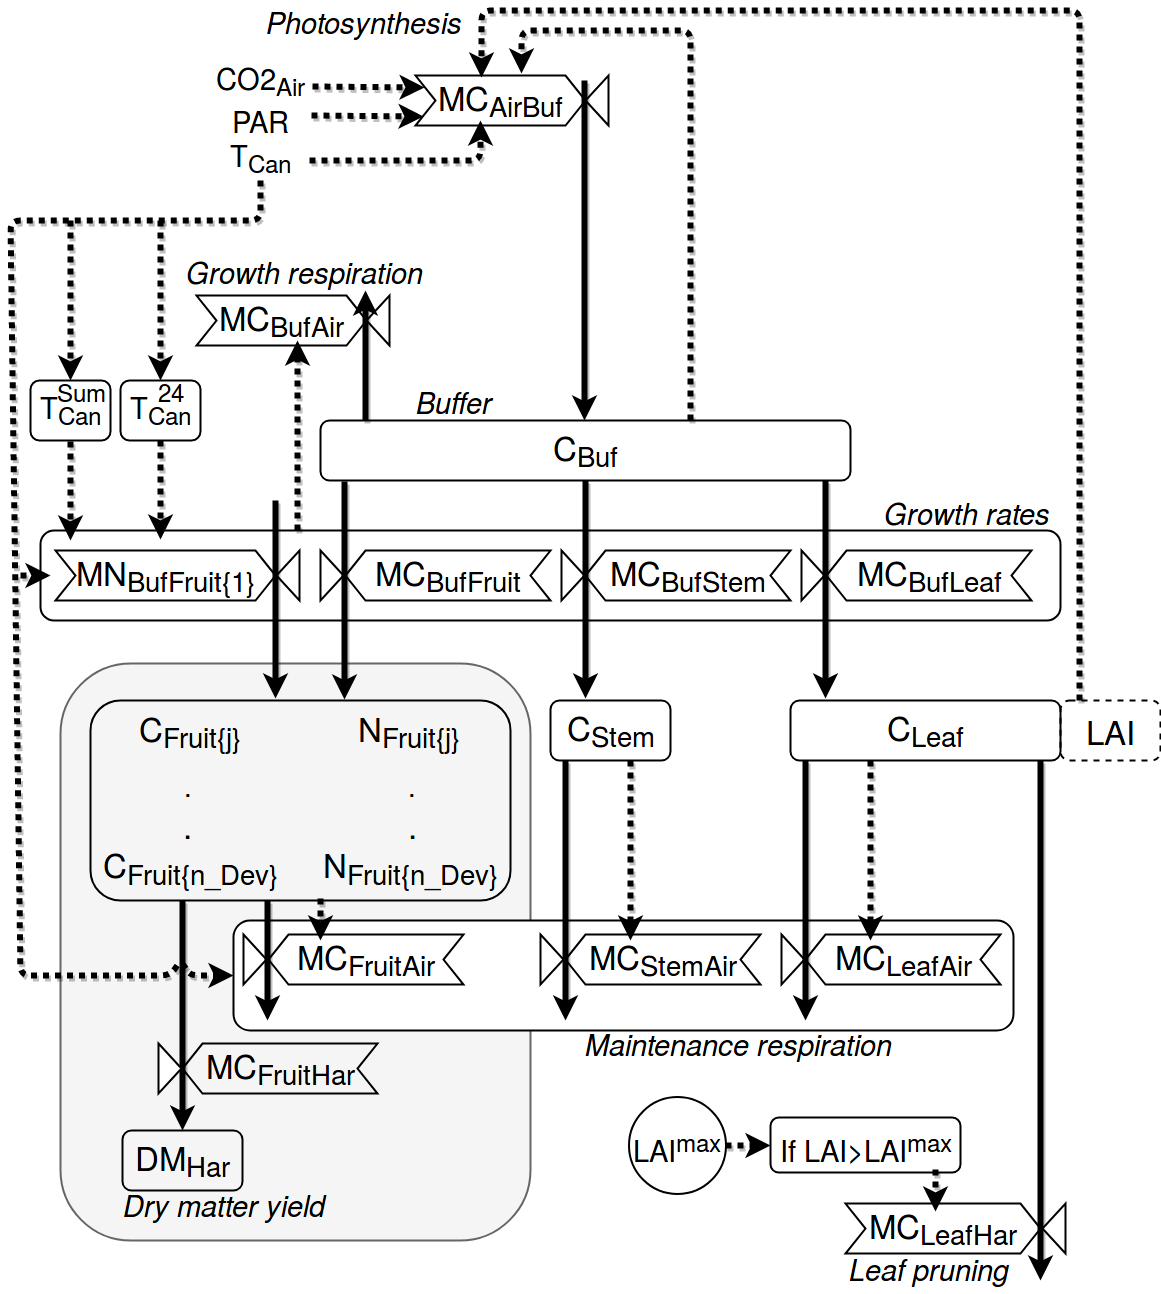
Schematic representation of the crop yield model adapted from [33]. Boxes define state variables (blocks), semi-state variables (dotted blocks) and carbohydrate flows (valves). Arrows define mass fluxes (solid lines) and information fluxes (dotted lines). For the purpose of readability, the grey box is a simplified scheme of the mass flows in the fruit development stages. A more detailed scheme of the latter can be found in the next figure.
To that end, the model applies carbohydrates mass balances on the buffer, fruits, stems and leaves. The mass balance on the buffer is defined by:
The carbohydrates produced by the photosynthesis are stored in the buffer. Whenever carbohydrates are available in the buffer, carbohydrates flow to the fruits, leaves and stems. This flow stops when the buffer reaches its capacity lower limit. In a similar way, the carbohydrate inflow from photosynthesis stops if the buffer reaches its maximum capacity.
The available carbohydrates for fruit growth are distributed to the different fruit development stages. The fruit growth period, defined as the time between fruit set and fruit harvest, is modeled using the “fixed boxcar train” method [22]. With this method, fruit development is modeled by distinguishing several successive fruit development stages, at which the number of fruits and the amount of carbohydrates are described. As shown in the figure below, the number of fruits and carbohydrates are considered to flow from one stage to the next with a specific development rate.

Schematic representation of the fruit development model adapted from [33]. Boxes define state variables (blocks) and carbohydrate flows (valves). Arrows define mass fluxes (solid lines) and information fluxes (dotted lines).
The carbohydrates stored in a fruit development stage j are described by:
for j = 1,2 … ndev, where ndev is the total number of fruit development stages. For the first development stage, the carbohydrate inflow from the previous stage \(\dot{m}_{C,Fruit[j-1]Fruit[j]}\) is zero. For the last development stage, the carbohydrate outflow to the next stage \(\dot{m}_{C,Fruit[j]Fruit[j+1]}\) is \(\dot{m}_{C,FruitHar}\).
The evolution of the number of fruits at a fruit development stage j is described by:
for j = 1,2 … ndev.
The evolution of the carbohydrates stored in the leaves is described by:
The Leaf Area Index (LAI), defined as the leaf area per unit of ground area, i.e. of greenhouse floor, is a semi-state variable of the model and determined by:
where SLA is the specific leaf area, whose value can be found in the literature.
The evolution of carbohydrates stored in the stems and roots is defined by:
The harvested tomato dry matter (DM) is assumed to evolve with a continuous harvest rate. Thus, the accumulated DM equals the carbohydrate outflow from the last fruit development stage:
The development stages of the crop are defined by the evolution of the canopy temperature:
Finally, the 24 hour mean canopy temperature is determined by a 1 st order approach:
Model flows
Canopy photosynthesis
The net photosynthesis rate, which is equal to the gross photosynthesis rate minus the photorespiration, is described by:
The inhibition of the photosynthesis rate by saturation of the leaves with carbohydrates occurs when the carbohydrate amount in the buffer exceeds its maximum storage capacity. The inhibition is described by:
Photosynthesis rate at the canopy level is described by:
The photorespiration is described by:
The electron transport rate is function of the potential rate and the PAR absorbed by the canopy, which is computed in the solar model and used in xx umol{photons} m⁻² s⁻¹.
The potential electron transport rate depends on temperature:
where
The CO2 concentration in the stomata is expressed as a fraction of the CO2 concentration in the greenhouse air [15]:
Finally, the CO2 compensation point (\(\Gamma\)) is described by:
The carbohydrate flow to the fruits, leaves and stems
The carbohydrate flow from the buffer to the fruits is function of the potential of fruit growth coefficient, the effect of temperature on the flow and the inhibition factors (\(0<h<1\)):
The carbohydrate flows from the buffer to the leaves and stem are not influenced by the instantaneous temperature and are therefore described by:
The inhibition of the carbohydrate flow to the fruits, leaves or stems caused by insufficient carbohydrates in the buffer is defined by its lower limit, which is equal to 5% of the buffer’s maximum capacity:
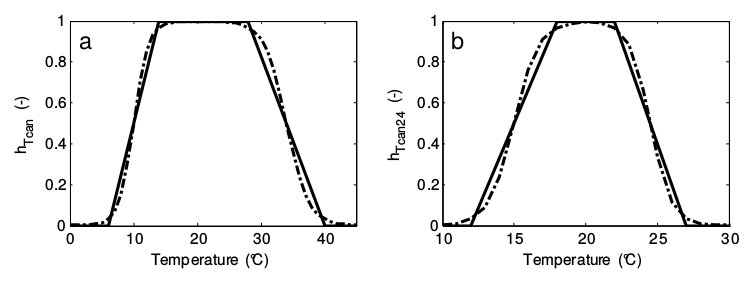
Crop growth is also inhibited by non-optimal levels of the instantaneous and 24-hour mean temperature. The inhibitions coefficients for these temperatures (\(h_{T_{Can}}\) and \(h_{T_{Can24}}\)) can be described by two trapezoid functions (solid lines in figure below). Since the functions are non-differentiable, they have been smoothed (dotted lines in figure below) to make them suitable for dynamic simulation.
At the first development stage of the plant, all carbohydrates are used for leaf and stem growth. The first development stage is thus a vegetative stage. When a given temperature sum is reached, the generative stage starts and the carbohydrates are divided over the fruits, leaves and stems. The fruit growth rate is assumed to start at zero and increase linearly to full potential with increasing temperature sum:
Since at the start of the generative stage \(T_{Can}^{Sum}\) is zero, the temperature sum when the generative stage starts \(T_{Start}^{Sum}\) is zero. Moreover, it is assumed that the fruit growth rate is maximal after one fruit growth period. Thus, the temperature sum when the fruit growth rate is at full potential \(T_{End}^{Sum}\) is 1035 ºC.
The temperature effect on the growth rate coefficient is considered to be linear, as described by [21]:
The coefficient is 1 at 20ºC beacause the growth rate coefficients were defined at 20ºC.
The fruit flow to fruit development stages
The number of fruits in the development stages (\(N_{Fruit[j]}\)) depend on the fruit set of the first development stage (\(\dot{m}_{N,BufFruit[1]}\)) and the fruit flow to the remaining development stages (\(\dot{m}_{N,Fruit[j]Fruit[j+1]}\)). The fruit set of the first development stage depends on the carbohydrate flow from the buffer to the fruits and on the maximum fruit set:
where the maximum fruit set is depends on the plant density and the canopy temperature:
The fruit flow through the fruit development stages is computed based on the fixed boxcar train mechanism of [22]:
for \(j=1,2...n_{Dev}\). The fruit development rate is defined by [21]:
The fruit flow inhibition coefficient, used to ensure that the fruits stay in vegetative stage at the first development stage, is described by:
The carbohydrate flow to fruit development stages
The amount of fruit carbohydrates in the development stages (\(C_{Fruit[j]}\)) depend on the carbohydrate flow from the buffer to a development stage (\(\dot{m}_{C,BufFruit[j]}\)) and the carbohydrate flow through the development stages (\(\dot{m}_{C,Fruit[j]Fruit[j+1]}\)).
The carbohydrate flow through the development stages is described by:
The carbohydrate flow to the first fruit development stage depends on the fruit set and the potential dry matter per fruit in the development stage one, as described by:
The carbohydrate flow from the buffer to the remaining fruit development stages, depends on the number of fruits, the fruit growth rate and the available carbohydrates for fruit growth (i.e. the total amount from the buffer minus the amount used in the first stage):
for \(j=2,3...n_{Dev}\), where the conversion factor \(\eta_{BufFruit}\) is described by:
The fruit growth rate depends on the fruit development stage and is described by [21]:
where
Growth and maintenance respiration
The growth respiration of the total plant (\(\dot{m}_{C,BufAir}\)) is equal to the sum of the growth respiration of the fruits, leaves and stems. For the leaves, the growth respiration is defined by:
The maintenance respiration of the leaves is described by:
The growth and maintenance respirations of the fruits and stems are described analogously to the previous equations.
Leaf pruning
It is assumed that leaves are pruned if the simulated LAI exceeds the maximum allowed value. The maximum allowed amount of stored carbohydrate in the leaves is described by:
The leaf harvest rate is determined by: